Background
A big challenge of network visualization and the legibility of network graphs is the visual clutter produced from the nodes and edges. Three-dimensional space provides more room for graph drawing compared to the flat area of paper and computer screens, but it is – as users of 3D graphics or CAD software painfully know – difficult and unintuitive to navigate through with a mouse and keyboard interface.
HTW Berlin and gamelab.berlin of the cluster of excellence Image Knowledge Gestaltung at Humboldt University Berlin organized a symposium in December 2016 to explore new possibilities of the virtual reality environment.
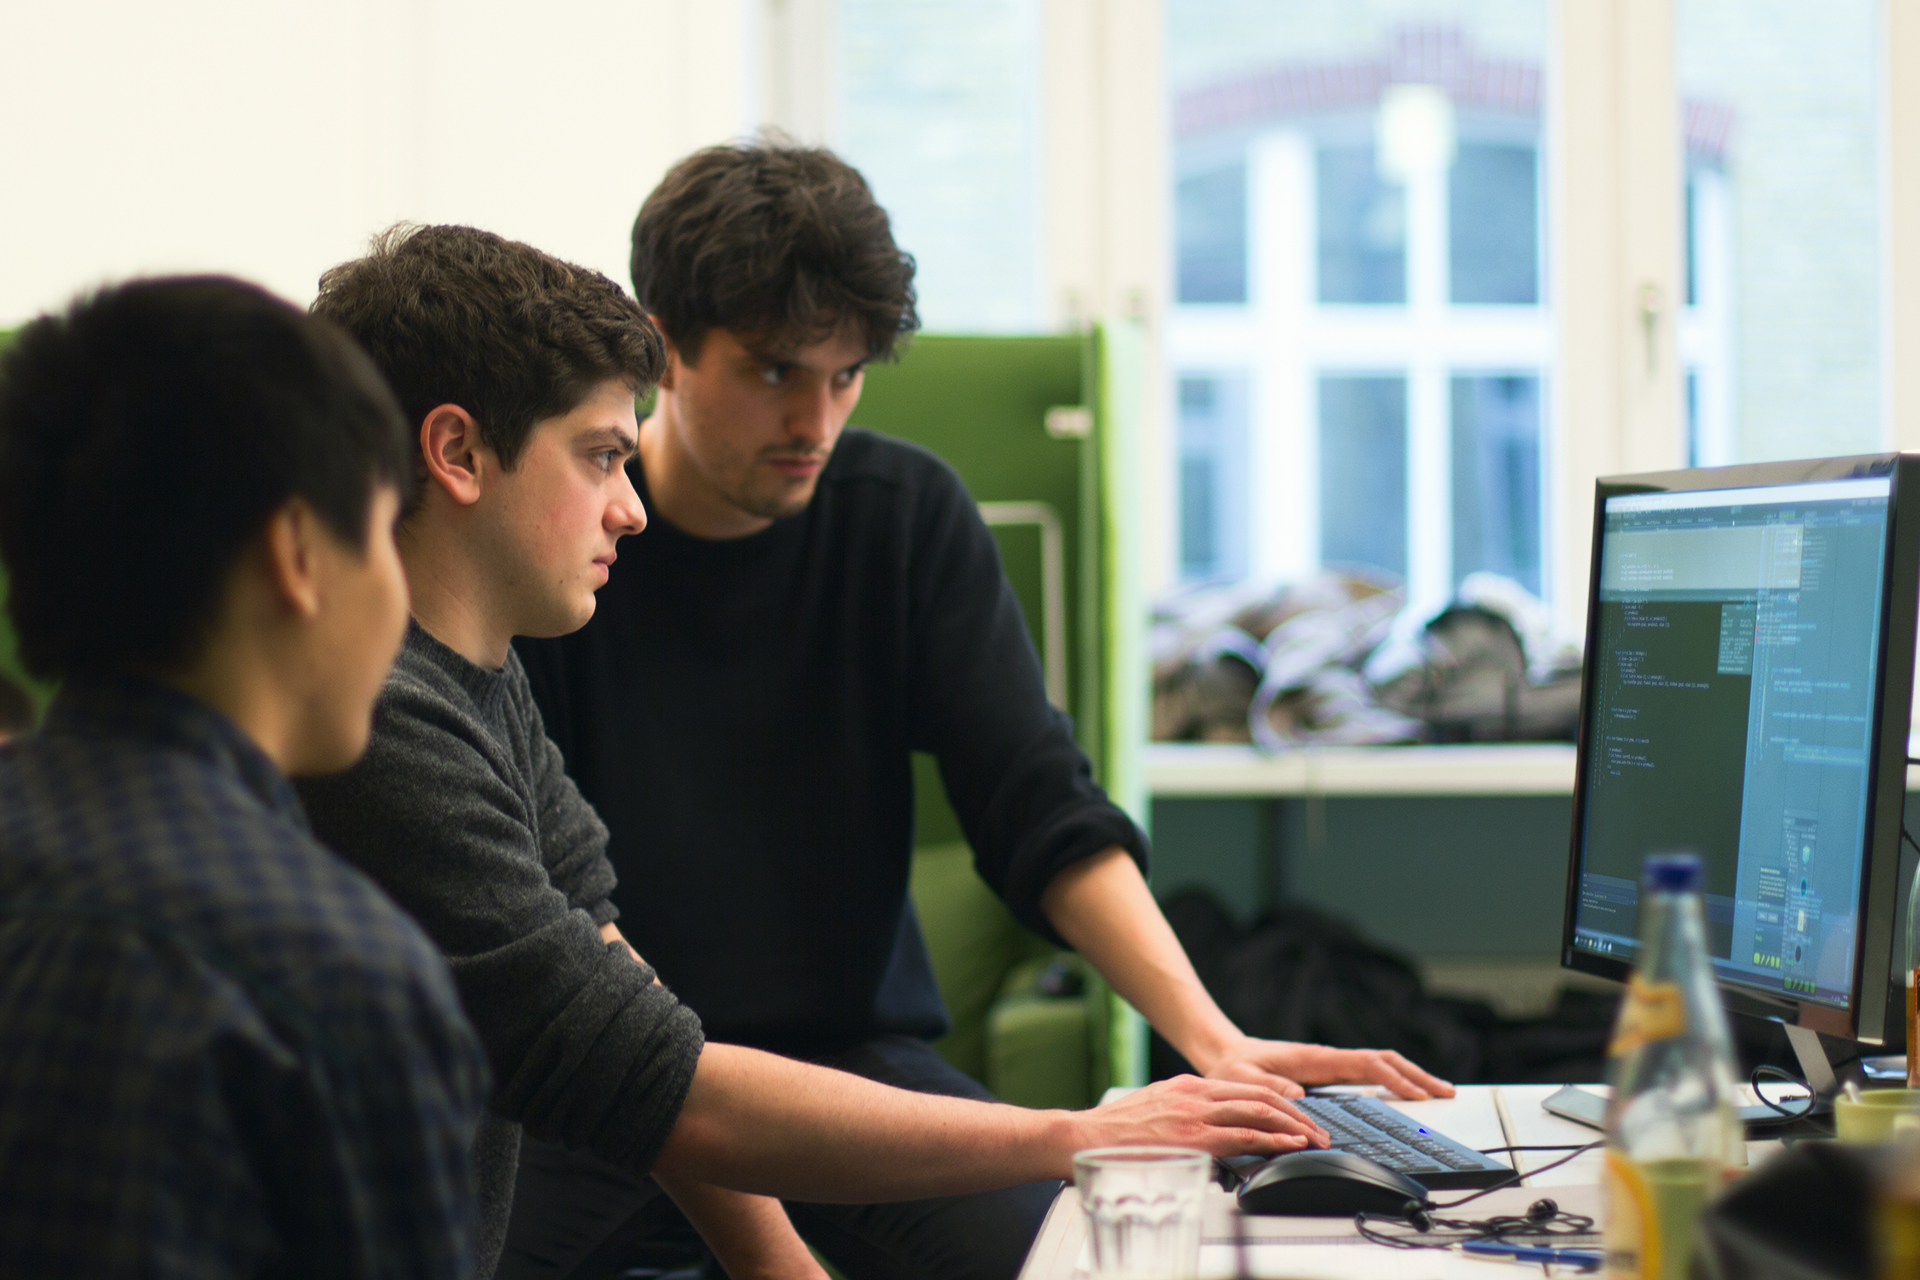
In the three day hackathon, my team and I decided to make network visualization a virtual reality experience.

The Software
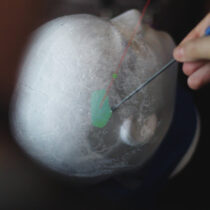
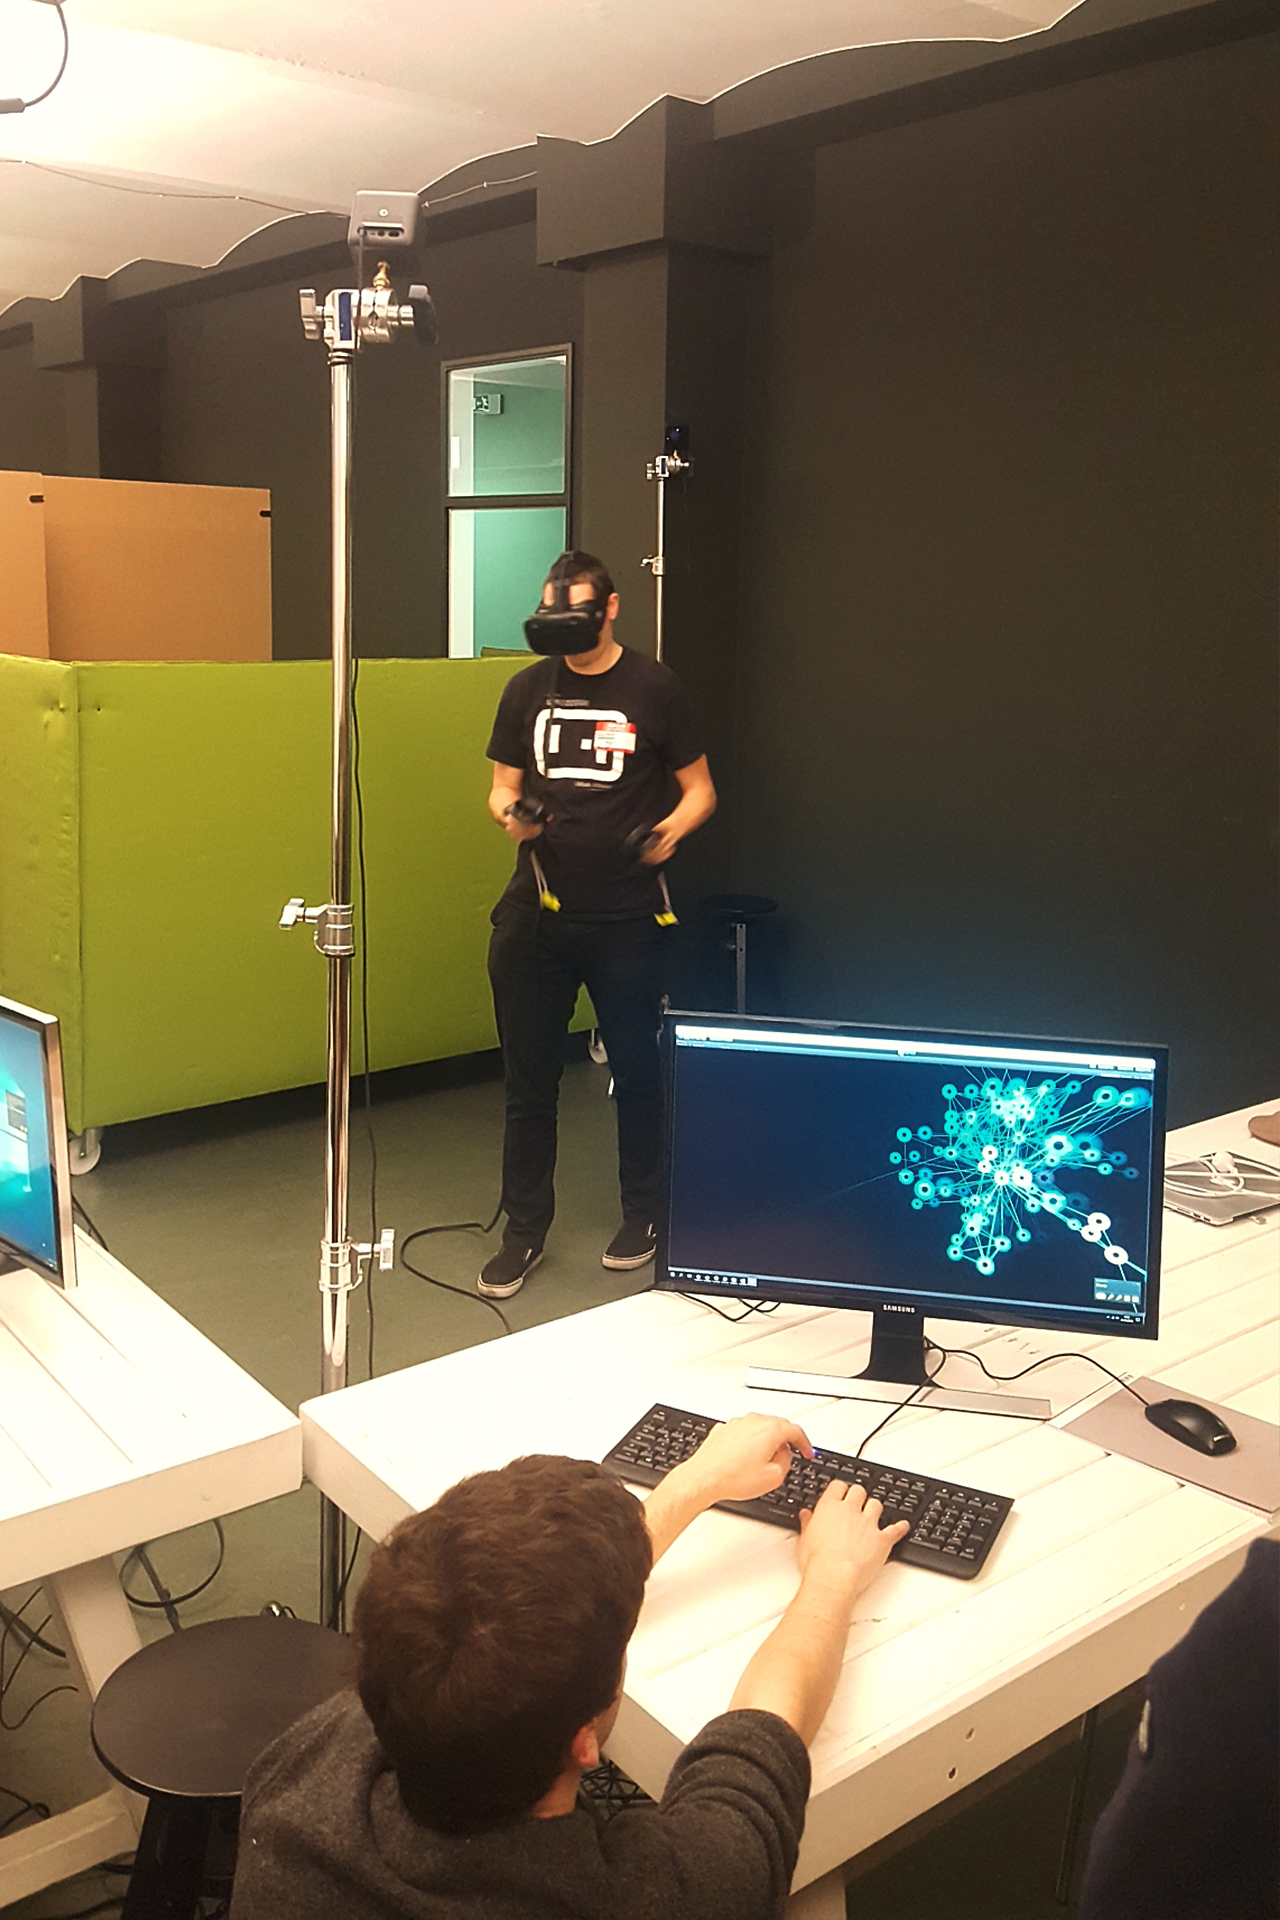
Our network graph is located in the center of a VR environment. The user can walk around the graph, look at it from all sides. With the controllers of the HTC Vive, the user can drag and manipulate the nodes as well as rescale and reposition the whole graph.
For more excitement in the game development context of the hackathon, we turned our network graph into an infection-style game, where nodes are becoming cancerous and have to be ripped out of the network before they infect the rest of the graph.

Technology
The software is written in the C# programming language on the Unity3D development platform using the HTC Vive Virtual Reality Environment.
Additional Links
Information on the “Reality Sucks” hackathon
© Luca Beisel, Pascal Lamouric, Johannes Christoph Mayer, Hoang Dinh, Wiza, December 2016