Real-time computing bears great potential for #network #visualization in the #digitalhumanities
Today I presented my prototype at the #GraphReflex barcamp by #DHDInfo AGs #DHTheorie & #Graphentechnologien
#dataviz #madewithunity pic.twitter.com/Y6GPC2JMYF— Luca Beisel (@lucabeisel) November 11, 2020
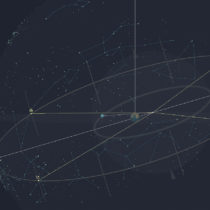
Network visualization and analysis are becoming more important research methods in the Digital Humanities.
I am developing a custom tool for graph drawing that facilitates interactive network research in a biographical database.
Unlike most visualization software that strictly separates data work from graph drawing, I am developing an intuitive environment for real-time network research.
Researchers can browse through and filter the data set via the minimalist interface without having to wrangle any raw data in the underlying database tables.
My aim is to enable an immersive research workflow without disruption by data acrobatics.

TECHNICAL
The 90000+ entry data set of the prototype is structured live: The software creates edges and nodes dynamically, using a custom force-directed algorithm for graph drawing. A dynamic “edge bundling” feature further reduces visual clutter.
The program is written in the C# programming language using the Unity3D development platform, making use of Unity’s novel DOTS framework.